How Do You Calculate the P/F Ratio, and What Does It Tell You?
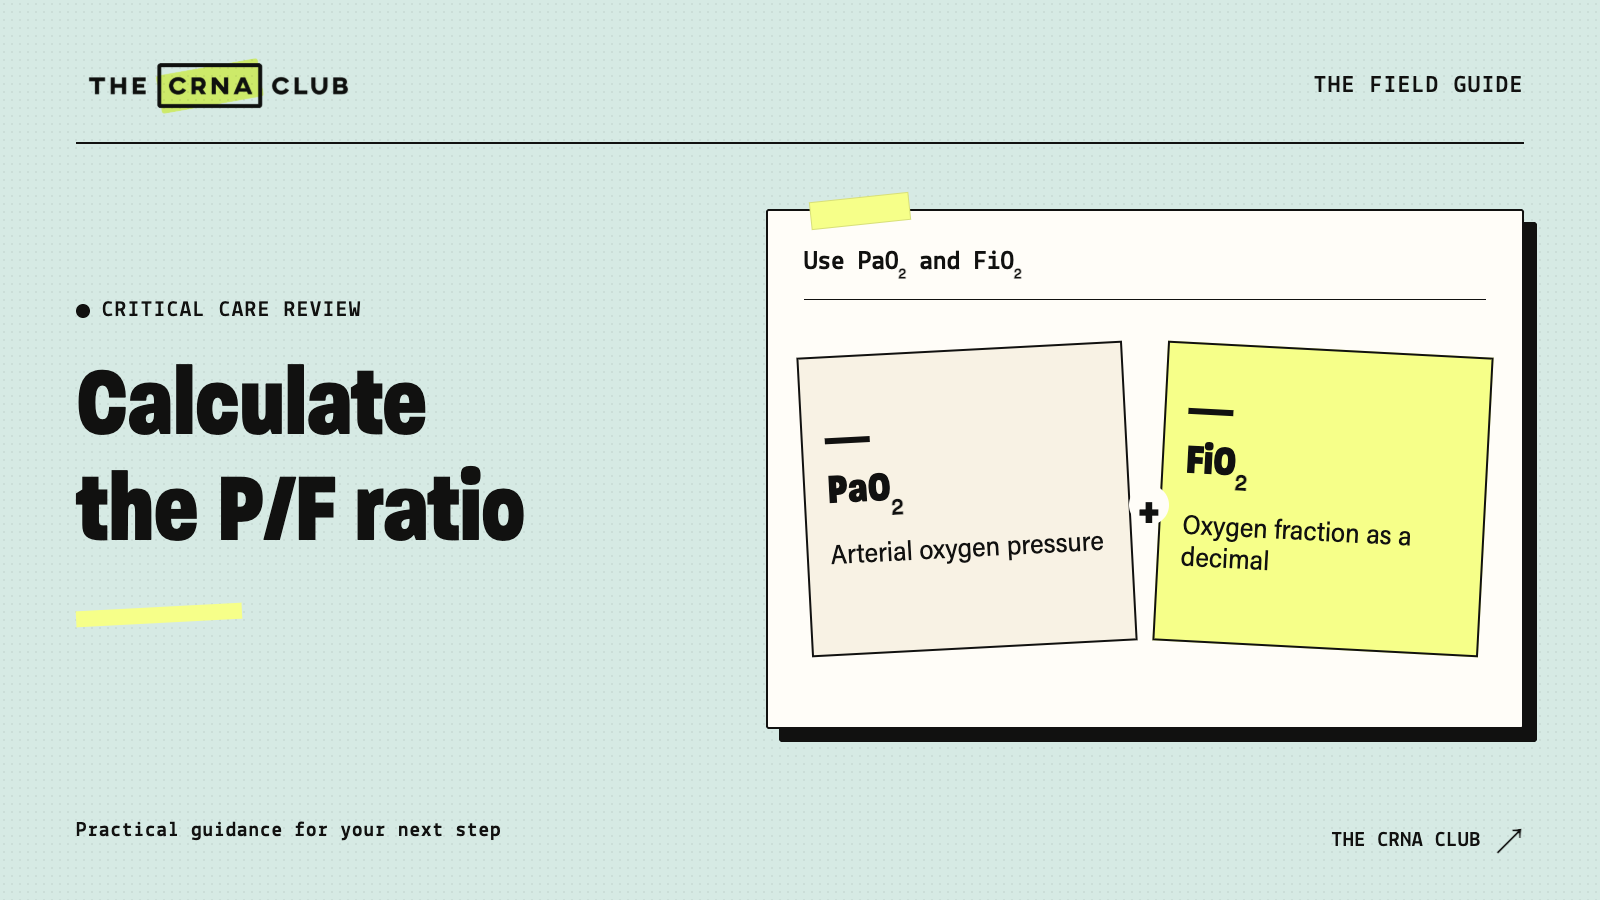
Calculate the P/F ratio by dividing arterial oxygen pressure, PaO2, by the fraction of inspired oxygen, FiO2. If PaO2 is 80 mmHg on 40% oxygen, the ratio is 80 ÷ 0.40 = 200 mmHg. It describes arterial oxygenation relative to the oxygen being supplied. The number alone doesn’t diagnose ARDS or choose a ventilator setting.
Sachi, CRNA
CRNA
In This Article (8 sections)
- What do the P and F stand for?
- How do you calculate a P/F ratio step by step?
- Why do two identical PaO2 values produce different ratios?
- How does the ratio relate to ARDS severity?
- What are the common calculation mistakes?
- How should you practice explaining it?
- Our Final Thoughts
- Keep studying respiratory physiology
For CCRN preparation, we suggest the CCRN Toolkit to connect respiratory lessons with practice questions and your study plan. You can also try the broader CRNA Club platform free for seven days for clinical and interview preparation.
What do the P and F stand for?
The P comes from PaO2, the partial pressure of oxygen in arterial blood. Get it from an arterial blood gas.
The F comes from FiO2, the oxygen fraction in the gas the patient inhales. Room air is about 21% oxygen, so its FiO2 is 0.21. A ventilator setting of 60% becomes 0.60 in the equation.
Use PaO2 and FiO2 from the same measurement period. Pairing yesterday’s blood gas with today’s oxygen setting produces a number without a useful clinical meaning.
This ratio differs from SpO2/FiO2, or the S/F ratio. A pulse-oximeter reading doesn’t replace the arterial PaO2 in a P/F calculation.
How do you calculate a P/F ratio step by step?
Use this sequence:
- Find PaO2. Confirm the result is arterial and note its units.
- Record the oxygen support at the time of the sample. Include the device, FiO2 and relevant pressure settings.
- Convert the percentage to a fraction. For 50%, use 0.50.
- Divide PaO2 by FiO2. For 75 mmHg on 0.50, calculate 75 ÷ 0.50 = 150 mmHg.
- Interpret the result with the patient. Add the timing, imaging and cause of the respiratory failure.
If your blood gas reports PaO2 in kPa, convert it before comparing with thresholds written in mmHg. Multiply kPa by about 7.5 to obtain mmHg.
At The CRNA Club, we suggest working the arithmetic before memorizing severity categories. Use the respiratory review in the CCRN Toolkit, then test whether you still recognize the problem when the oxygen percentage changes.
Why do two identical PaO2 values produce different ratios?
Because the amount of supplied oxygen differs. Consider two hypothetical intubated patients with the same PaO2 and PEEP of 8 cmH2O:
| Example | PaO2 | FiO2 | Calculation | P/F ratio |
|---|---|---|---|---|
| A | 80 mmHg | 0.40 | 80 ÷ 0.40 | 200 mmHg |
| B | 80 mmHg | 0.80 | 80 ÷ 0.80 | 100 mmHg |
Patient B needs a higher inspired oxygen concentration to reach the same arterial oxygen pressure. The lower ratio describes a worse oxygenation result relative to the supplied oxygen under those measurement conditions.
The calculation doesn’t tell you why. Pulmonary edema, pneumonia and other processes require their own assessment. And a ratio changes with FiO2, PEEP and the patient’s physiology, so follow trends with the support settings attached.
How does the ratio relate to ARDS severity?
For intubated ARDS, the global ARDS definition uses these oxygenation categories with PEEP of at least 5 cmH2O:
- Mild: more than 200 and up to 300 mmHg.
- Moderate: more than 100 and up to 200 mmHg.
- Severe: 100 mmHg or less.
At exactly 200, the ratio falls in the moderate category. At exactly 100, it falls in the severe category. Those boundaries apply only after you’ve established the relevant ARDS criteria and measurement conditions.
ARDS also requires new or worsening respiratory failure within one week of a known insult or new or worsening respiratory symptoms, with bilateral findings on eligible lung imaging. The respiratory failure must not be primarily explained by fluid overload or cardiac failure. A P/F ratio of 150 by itself doesn’t establish the diagnosis.
The newer global definition also recognizes nonintubated ARDS, including qualifying patients on high-flow nasal oxygen at 30 L/min or more. Don’t carry the intubated severity table into every oxygen-device setting without checking the definition being used.
For the mechanism behind impaired oxygenation, read our explanation of ARDS, shunt and lung compliance. This calculation guide focuses on using and interpreting the number.
What are the common calculation mistakes?
Dividing by 40 instead of 0.40. With a PaO2 of 80, that gives 2 instead of 200. Write the fraction before reaching for a calculator.
Using a venous PO2. Venous oxygen pressure doesn’t substitute for arterial PaO2.
Treating a low-flow nasal cannula as an exact FiO2. Delivered oxygen varies with breathing pattern and device conditions. A ratio based on an estimated FiO2 has uncertainty in its denominator.
Choosing treatment from the ratio alone. The need for intubation, changes in support or prone positioning depends on the whole clinical situation and applicable evidence. A number doesn’t assess work of breathing, airway protection or circulatory tolerance.
Assuming a better ratio proves every part of the patient improved. Oxygenation and circulation interact, but the P/F ratio doesn’t measure cardiac output or tissue oxygen delivery.
How should you practice explaining it?
Try this original question: “PaO2 is 90 mmHg on FiO2 0.60. What is the P/F ratio, and what else do you need to know?”
The calculation is 90 ÷ 0.60 = 150 mmHg. Then ask about the device and pressure support, the timing of the gas, imaging and the clinical explanation. If this is intubated ARDS with the required PEEP, 150 lies in the moderate oxygenation category.
We suggest practicing both parts of the answer: calculate correctly, then say what the result establishes. For related physiology, compare low V/Q and shunt. Use the Mock Interview Lab when you’re ready to explain your reasoning out loud.
Our Final Thoughts
Write the oxygen percentage as a fraction and attach the support settings to the result. Those habits make your P/F calculation easier to trust and your clinical explanation much stronger.
Keep studying respiratory physiology
Review the concepts and practice applying them with the CCRN Toolkit. For the wider learning library and interview tools, try The CRNA Club free for seven days.